
The average is not 5
Statistics for permanently online dummies

One thing that really annoys me, a data analyst, is the lack of understanding of basic statistics when it comes to discussing things like attractiveness ratings.
Exhibit A - Dataclysm
For example, consider the famous OkCupid attractivenes study results from the book Dataclysm:
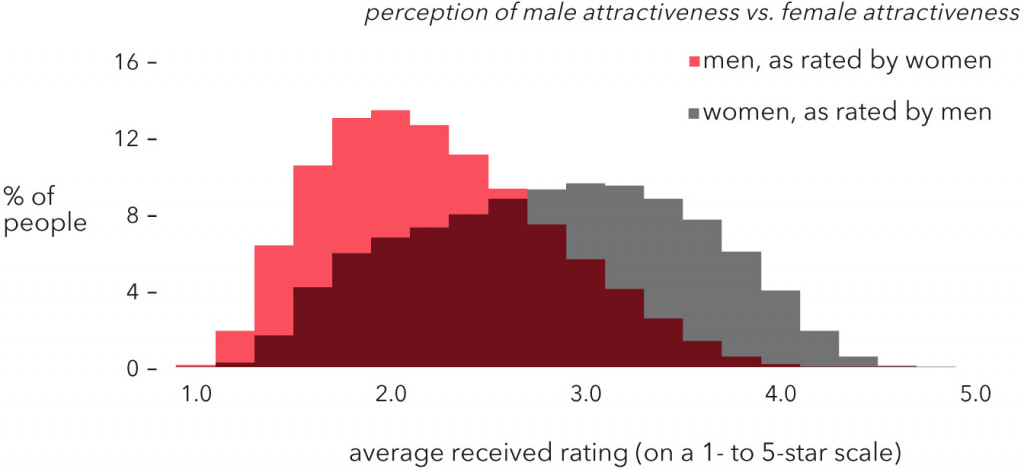
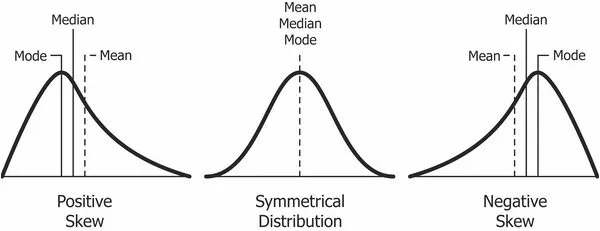
Many men (especially incels) note the positive/right skewed distribution of the “men, as rated by women” results and comment that “women rate most men as below average” and that for some reason, this is wrong or unfair.
Exhibit B - Shiro Protocol
A guy running the Shiro Protocol Youtube channel attempted to collect somewhat unbiased results of how people rank themselves on the 1-10 scale, and came up with this:

This is a negative/left skewed distribution.
An actual quote from the video:
The rest of the scores are spread in the middle range, resulting with an average score of 6.3/10.
In total, 678 participants gave themselves a 6 or higher. That means, nearly 70% of people think they are better looking than average.
My immediate thought was: “Dude, you’ve just literally said that the average is 6.3!”.
Exhibit C - Aella
In her recent post, Aella writes:
In my ‘how hot are you’ survey, women mostly rated themselves between 6-7/10 regardless of how hot they actually were - high enough to be above average, but low enough to have plausible deniability.
(…)
So we end up in a world where we’re all secretly believing we are a 6.5/10, despite the fact that the average must be 5.
No, the average doesn’t have to be 5, as we will see in the following example.
Analyzing completely made up data
Let’s say that some people rated some other people’s (or their own, it doesn’t matter) attractiveness on a 1 to 10 scale and we are now reviewing these completely made up results:

Like the Shiro Protocol example this is a negative/left skewed distribution.
Typically, most people would look at such distribution and say something like “Most people’s ratings are above average - this is weird/wrong/unfair!”.
To which I would respond - “Ok, but how do you know what is the average”?
The arithmetic mean
“The average” is what statisticians call a central tendency - a central or typical value in a distribution.
The most common, easiest to calculate and default type of average is the arithmetic mean: the sum of results divided by their number.
For our made up dataset, the arithmetic mean, a.k.a. “the average”, is:
1 * 2% + 2 * 4% + 3 * 8% + 4 * 10% + 5 * 12% +
6 * 18% + 7 * 22% + 8 * 15% + 9 * 7% + 10 * 2% = 5.99
So, “the average” is basically 6.
How many people rated “above average” then?
22% (7) + 15% (8) + 7% (9) + 2% (10) = 46%
Did “most people rate above average”? No. 1
The midrange
The “most people rated above average” fallacy results from the fact that most people actually refer to a different type of average - the midrange. More specifically, it is based, I believe, on a wrong definition of midrange.
The midrange is the arithmetic mean of the minimum and maximum value. For our 1-10 ratings, it’s (1+10) / 2 = 5.5
The problem with above is that first, 5.5 is not practical since it’s not a whole number, and second, calculating an average of two numbers is beyond the math capability of most people.
I believe that if I did a street poll asking “What is the average of 1 and 10?” most people would answer “5”. Most people, I think, would approach this problem with a simple heuristic: “The top of the range is 10, so the average will probably be 10 / 2 = 5”. This would be correct if the minimum rating was 0, but it’s not - it’s 1.
This is how, I believe, we end up with “the average must be 5”.2
The median
The median is the middle value - if we sort our results, we can find a middle value where ~50% of results are above it and the other ~50% are below it.
To see the median, we can stack all of our results on one bar and see which result set does the 50% line cross through:

The 50% goes through the 6 rating, so 6 is the median - the middle value of our dataset.
The mode
The mode is the most common value in our result set. In our case it’s the longest bar on the chart: 7, with 22% results.
“Most people rated others/themselves as 7/10”.
Depending on our problem, the mode - most common value - might be a better type of average than the mean, midrange or the median. Note that phrases like “a common man” and “an average man” are practically synonymous.
There are many other averages, or central tendency measures, but for our problem, let’s stick with the above ones:
Mean: 5.99 = ~6
Midrange: 5.5
Median: 6
Mode: 7
Yet, the average that most people come up here is the “wrong midrange” type of average: “the average must be 5”.
What do the 1-10 ratings even mean?
Here, we might need to step back and think about what do the 1-10 ratings actually represent.
Some might say that they represent deciles - they divide the population into 10 bins such that the 1’s are are the 10% least attractive, 2s are the next 10%, and so on, and the 10’s are the 10% most attractive. However, by definition, the decile distribution is uniform, like that:

Instead, I believe most people expect to see something like the normal distribution:
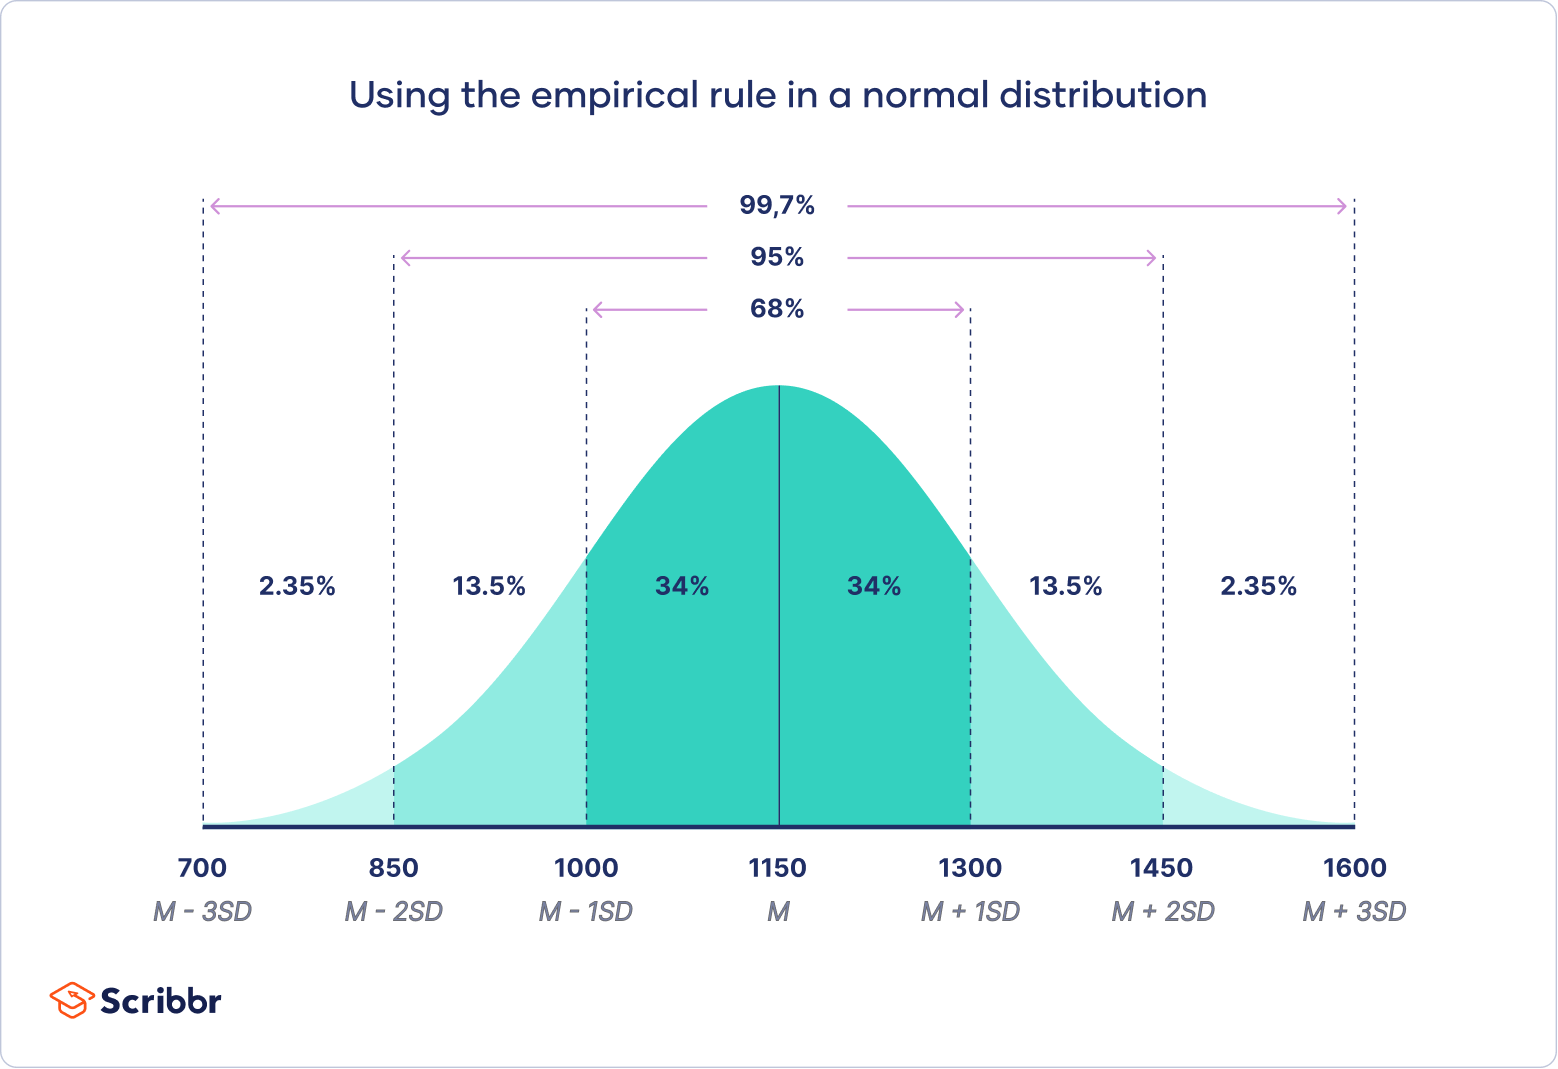
The width of the normal distribution is characterized by the standard deviation, such that:
68% samples are within +/-1 standard deviation from the mean
95% samples are within +/-2 standard deviations from the mean
99.7% samples are within +/-3 standard deviations from the mean
For a hypothetical normal distribution of 1-10 attractiveness ratings with mean = midrange = 5.5, our standard deviation would be something like 1.5 points, such that:
68% people are within 4-7 (5.5 +/-1.5)
95% people are within 2.5-8.5 (5.5 +/-3)
99.7% people are within 1-10 (5.5 +/-4.5)
I believe that this is what most people imagine as the “true” or “correct” distribution of 1-10 attractivieness ratings in the population.
The average doesn’t have to be 5
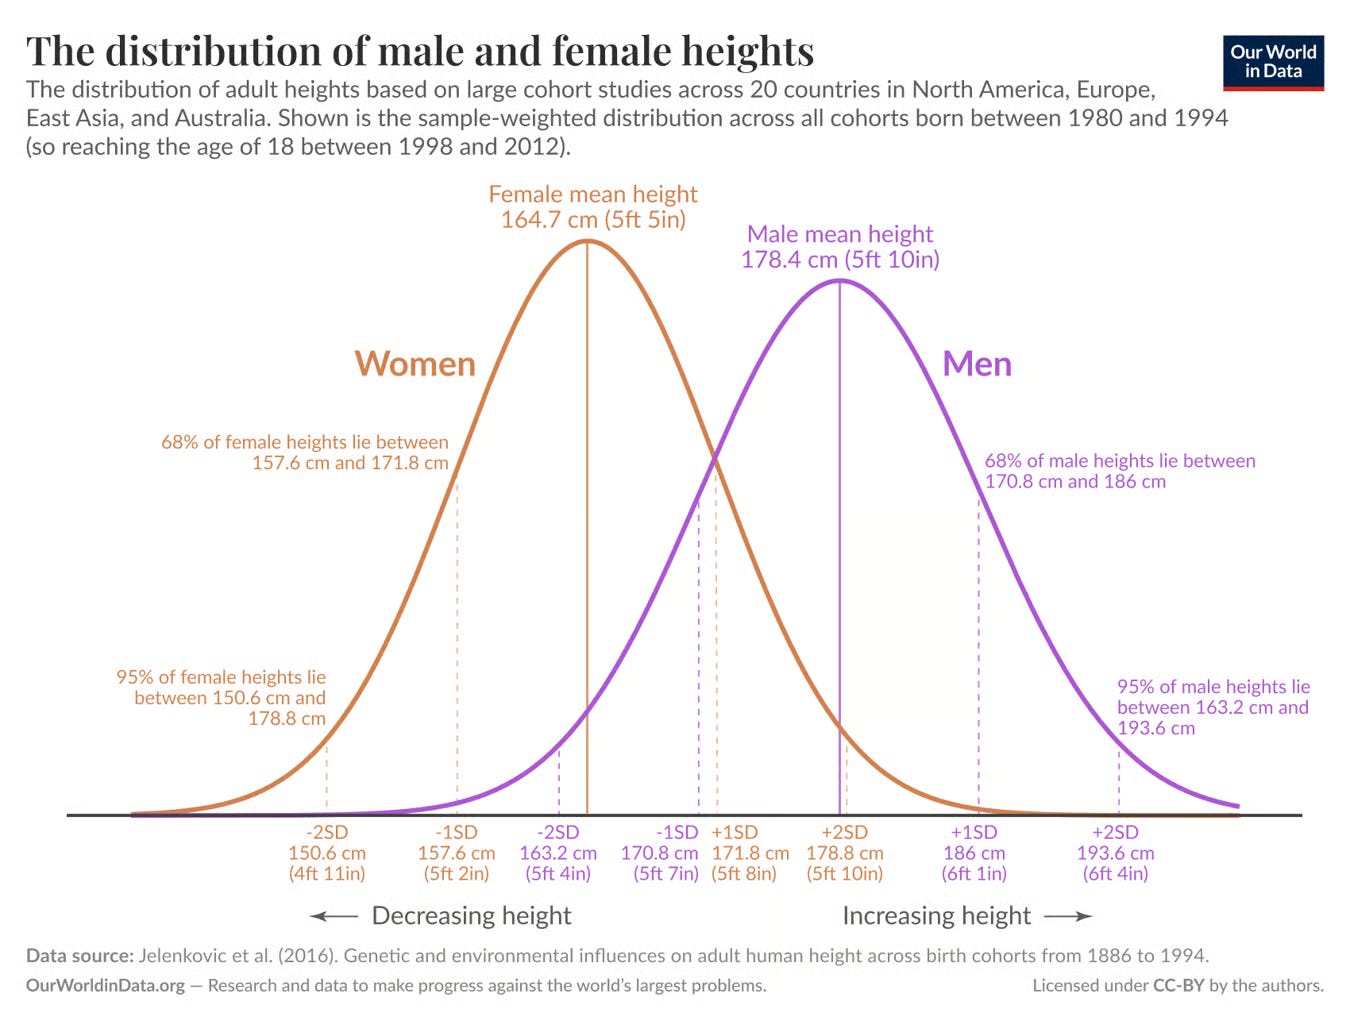
Many natural traits, such as height, are distributed along a bell curve, or normal distribution:
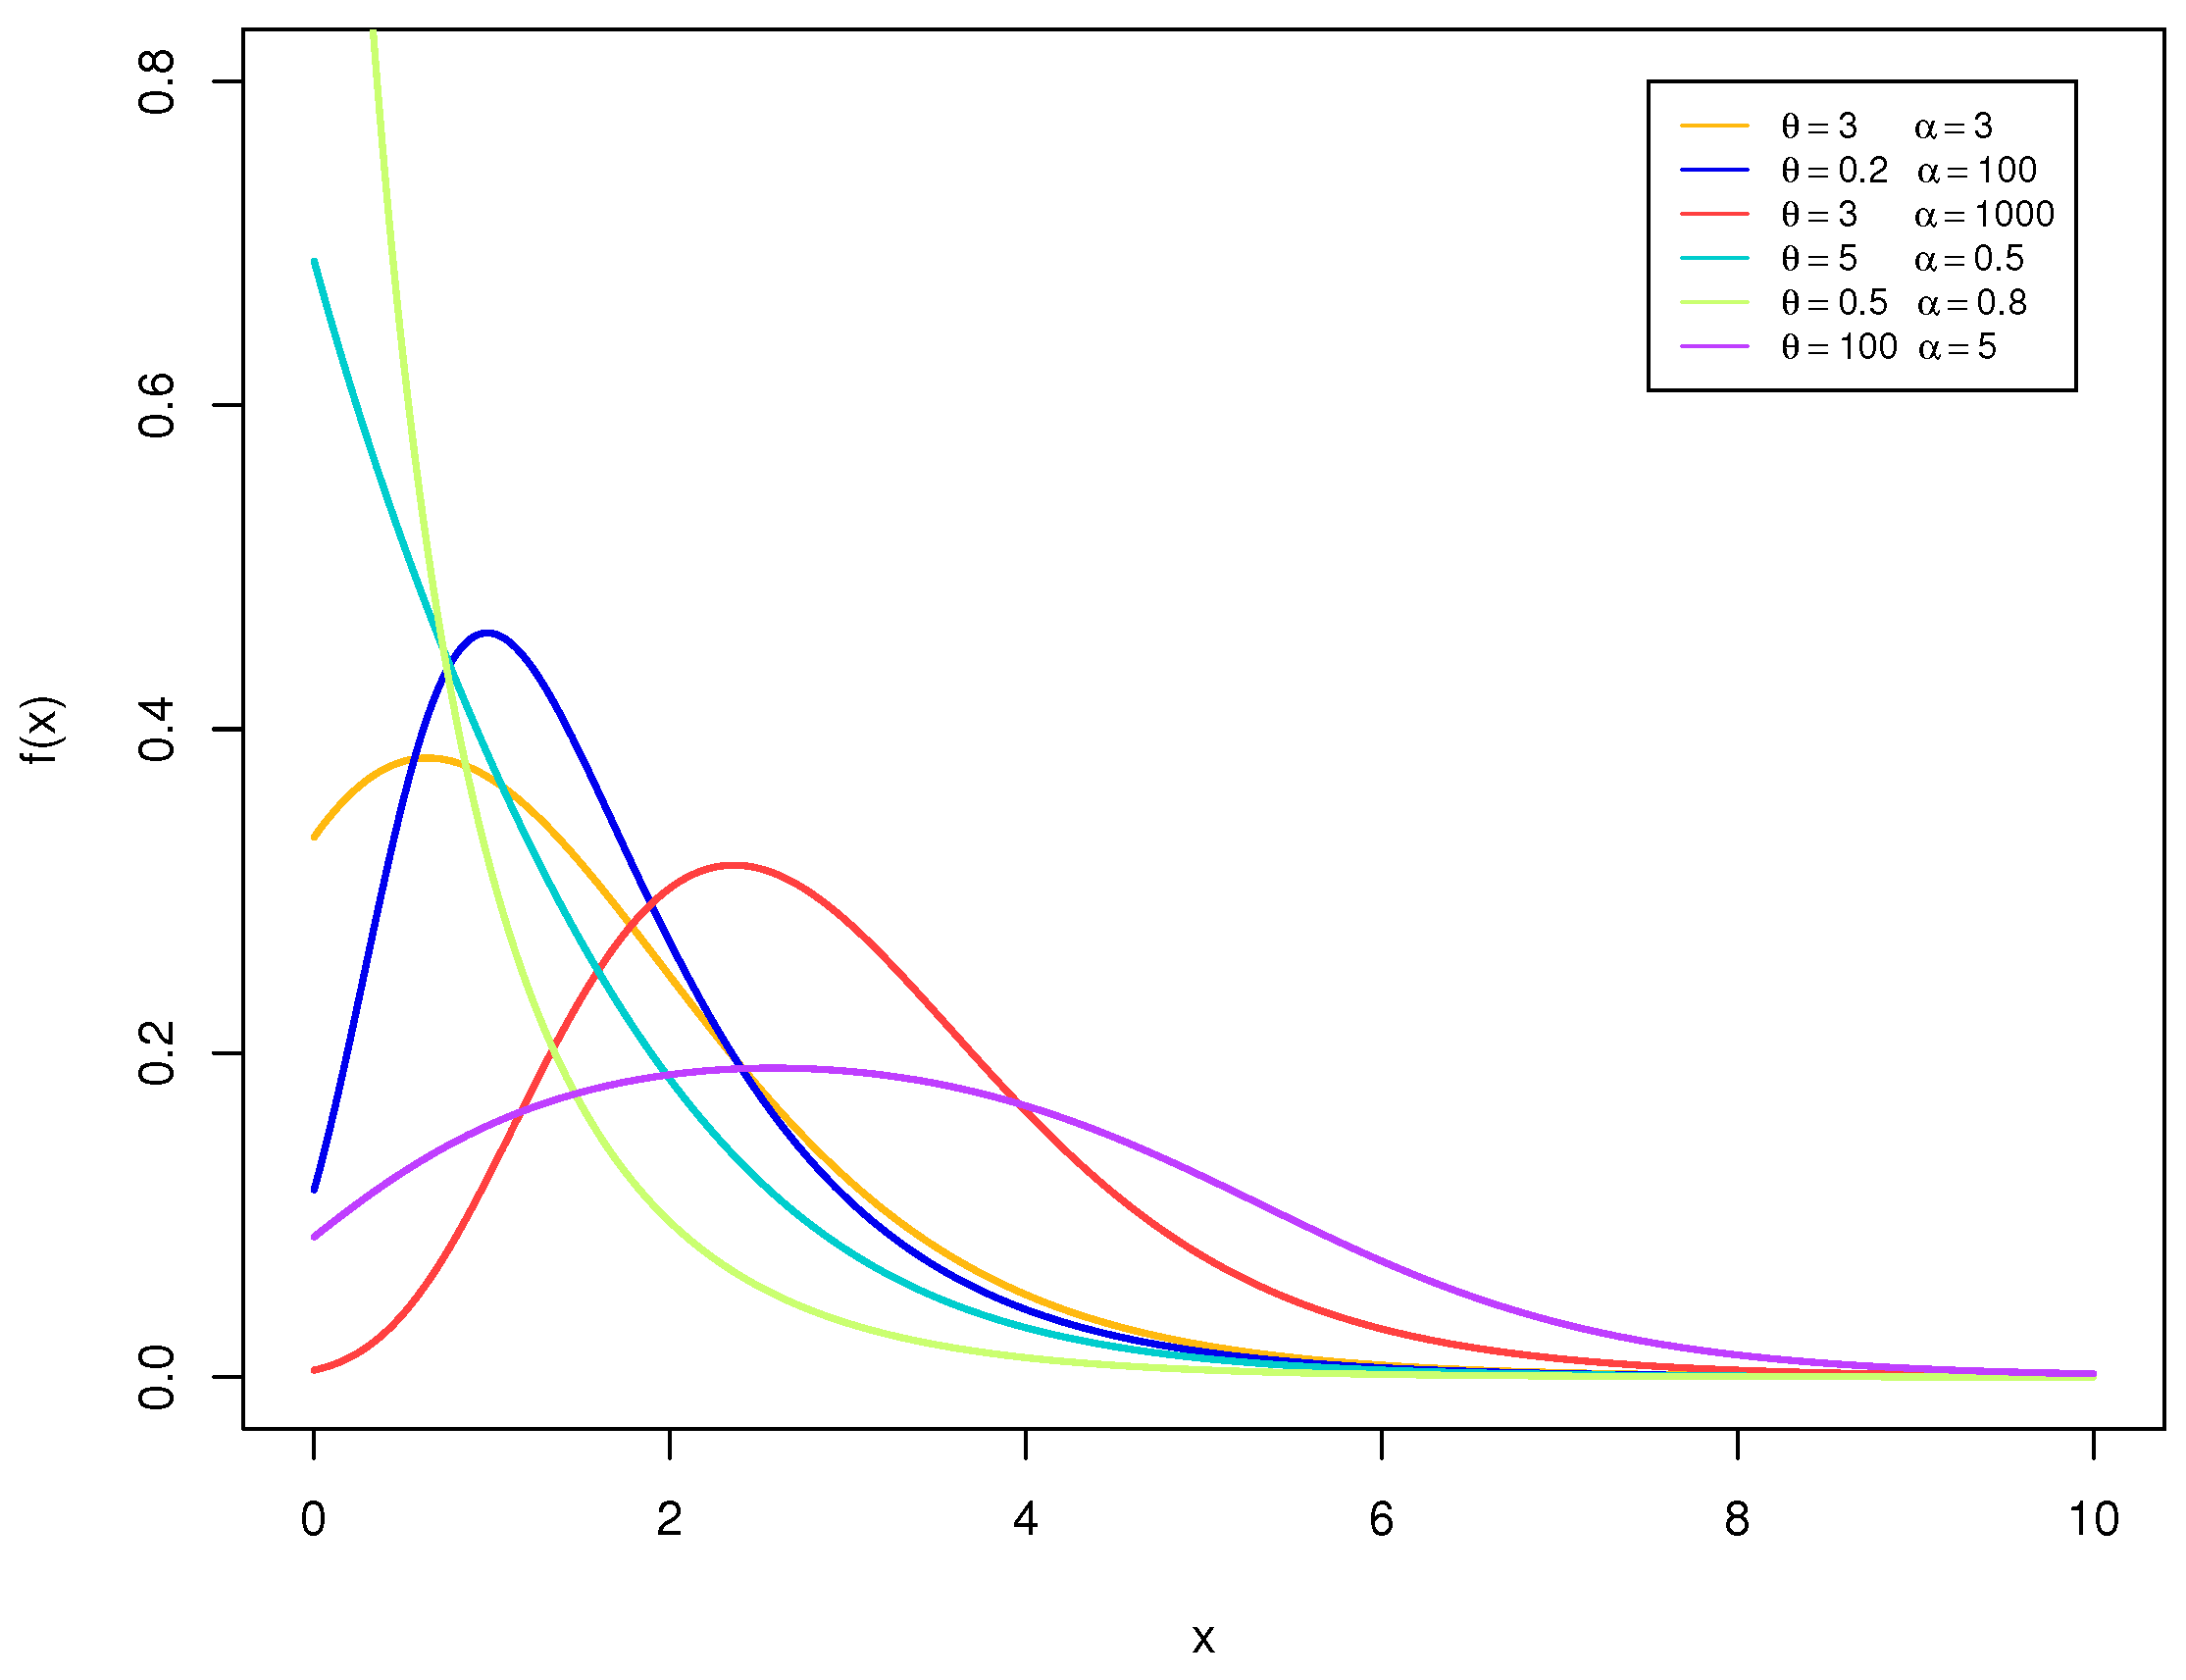
On the other hand, malleable traits such as skills that (at least some) people develop in their lives often have an exponential distribution:

Consider things like skateboarding or playing the violin: most people cannot do any of this at all, but there is a small group of amateur players/skaters, even smaller group of professional players/skaters, and a tiny number of the best of the best.
But is attractiveness a natural trait or a malleable one?
Many, it not most, believe it’s a natural trait - and thus, expect the attractiveness distribution to be normal and that “average must be 5”. Most notably, the blackpilled incels developed their “looks theory” that describes how their short height, boyish faces and retracted jawlines make them irreversibly unattractive - “It’s over”.
But we also know that one can really do a lot to improve their attractiveness. You can eat well and hit the gym to stop being skinny or fat. You can get some better clothing. You can have various cosmetic or surgical procedures done, if you’re up for it. And finally, if you’re a woman, you can quickly, efficiently and inexpensively improve the attractiveness of your face by puting on some makeup.
Now, some of you might object that the above is just faking attractiveness, and the “natural” part is what we should focus on. The thing is, despite this being a trendy idea, no one really cares about “natural beauty”.
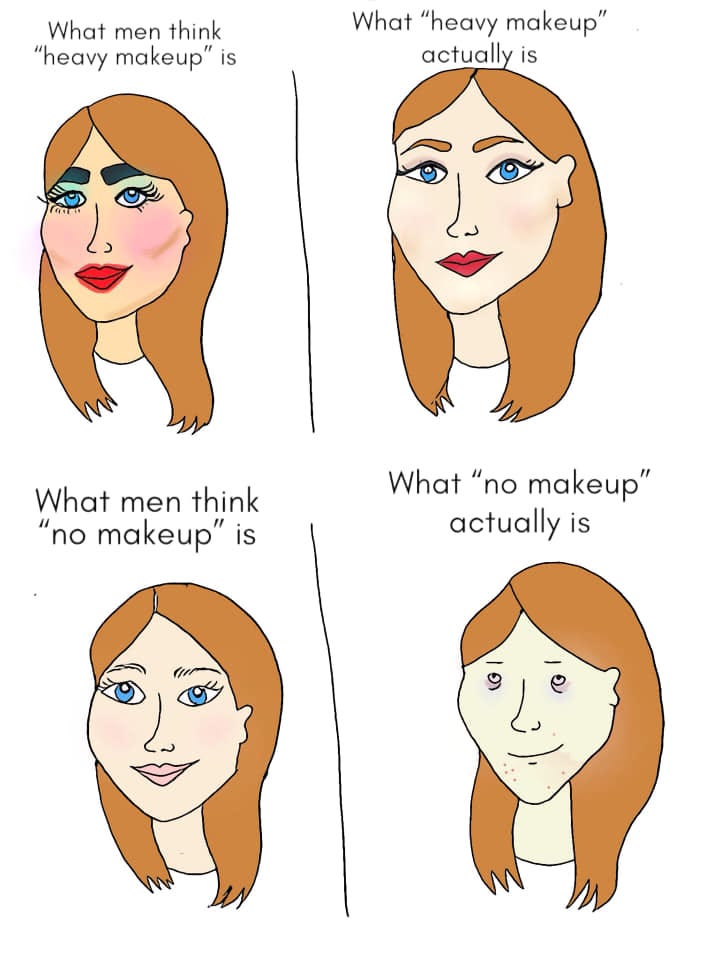
If you close your eyes and imagine a 10/10 woman, you will most likely picture a beatuful girl in a stunning outfit and heavy makeup. Because this is what makes women most attractive. Note how most of the time when no-makeup photos of celebrities (considered 10s by many men) go viral, the internet men are like “Wow, she’s actually mid!”.
At this point, we no longer know what natural look/”no makeup” is, as shown in the popular makeup memes - here’s one by Cartoons Hate Her:
So, attractivenes is both natural (like height) AND malleable (like skills) - everyone has some baseline natural attractiveness, but can also make efforts to improve it (or neglect it and become fat and ugly).
Now, let’s look at some motivations that cause people to improve their attractiveness.
Like skills, attractiveness is valuable. The most attractive men and women can monetize their attractiveness by working in modelling, show business, social media or the adult industry. But everyone else is still aware how attractiveness can improve their professional, social and romantic lives, which drives them to improve it as well, albeit usually not as much as those who choose to monetize it.
The value of attractiveness skews the normal distribution bell curve of natural attractiveness in the positive/right direction - “the most attractive are getting even more attractive“, which moves the top of the range up - and makes it more similar to the exponential distribution typical for skills - like the blue and red curves below:
The second important motivation is shame.
The distribution of most skills in population is exponential, because most skills are optional. There is no shame if you can’t ride a skateboard or play the violin - it’s not required.
But if you’re a woman, you have to be at least mid.
Women are shamed for being below average in attractiveness in ways men are not. Which drives those who are naturally below average to double down on their attractiveness improvement efforts.
For example, I have a female friend that is naturally below average in attractiveness. Her face is not great, she’s quite short, but not petite, as she probably has a pear-shaped figure. I’m saying probably, because she always wears loose or baggy clothes so no one really knows how her body actually looks like. She also wears heavy makeup daily (or at least whenever we see each other). With all these efforts, she manages to come off as mid. She really pulls it off.
Many (if not most) naturally below average women do, or at least try doing the same.
Men are not shamed for looking below average like that. Though, there are other areas where men are shamed for being below average, like strength or income, which drives below average men to improve in a similar fashion.
The efforts driven by shame move the below average women towards the mid area. In statistical terms, it skews the distribution in the negative/left direction.
Eventually, we have:
For men: normal distribution of natural attractiveness + positive/right skew from value of attractiveness = a positive/right skewed distribution
For women: normal distribution of natural attractiveness + positive/right skew from value of attractiveness + negative/left skew from shaming below-average attractiveness = a near-normal distribution (both effects cancel each other out)
If we assume that the negative/left skewing impact of shaming below-average women is slightly higher than the positive/right skewing impact of the value of attractiveness, we get this:
On the other hand, we also have the negative/left skewed distributions of self-rated attractivenes (like the one from the Shrio Protocol survey). I also recall seeing similar distributions as results of “rate your romantic partner” surveys (unfortunately I can’t find them right now).
In that case, I believe that both - one’s rating of themselves and their partner - are a very biased result of multi-objective optimization.
When thinking about how attractive we want to be, or how attractive we want our partner to be, we have three conflicting objectives we need to optimize for:
The value of attractiveness - The most attractive person - a 10 - is the most valuable.
The cost of attractiveness - Attaining and maintaining top level attractiveness requires effort and can be expensive. Conversely, low attractiveness is free and effortless.
Social conformity - Imagine that you, your partner, or both of you are 10s, but all of your friends are mids (5-6). This situation could put a strain on your social relationships - you are not conforming to the social norm set by others around you. Obviously, if you or your partner are ugly, your mid friends could also ostracize you. For social conformity, it’s best to be as attractive as most people around you - and most people are mid.
The usual outcome of this multi-objective optimization is that we want both ourselves and our partners to be a little above average - a “beatiful mid”:
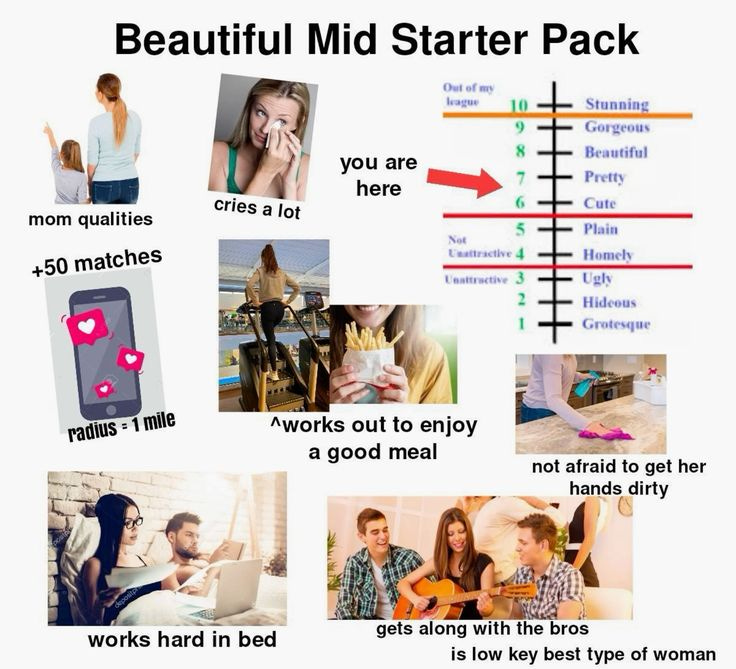
Notice how I said “we want”, but the surveys are more about how we actually see ourselves and our partners.
I believe that the fact that everyone wants to be a “beatiful mid” and also have a “beatiful mid” partner triggers wishful thinking and biased survey responses. And that’s how we end up with negative/left skewed distributions for self-rating and partner rating.
Beauty is in the eye of the beholder
To sum up: It is not reasonable to expect that 1-10 attractiveness survey results will be symmetrical normal distributions centered around the midrange, or that the “averge must be 5”:
Men rated by women: positive/right skewed (average is ~3.5)
Women rated by men: symmetrical/normal, with slight negative/left skew (average is ~6)
People rating themselves and their partners: negative/left skewed (average is ~6.5)
This is because:
People value attractiveness and strive to improve it.
Women are shamed for being ugly, and those who are naturally below average put extra effort into coming off as least as mid.
People optimize between the value and cost of attractiveness and social conformity, and end up preferring to be and date “beatiful mids”.
People’s perception and survey responses are biased by their wishful thinking.
Also, note that way the opposite sex ratings are skewed is just a product of how a culture - in this case, the modern Western culture - views attractiveness:
Whether male/female attractiveness is valued - in our Western culture, both are valued, but obviously the female attractiveness is valued more.
Whether male/female ugliness is shamed - in our Western culture, only female ugliness is shamed.
What measures of attractiveness improvement are available.
We can also think of how these change across cultures:
In Ancient Greece, male attractiveness was probably valued as much (if not more) than female attractiveness. It’s also possible that male ugliness was shamed as well, but I’m not sure.
In pre-modern and third world cultures, many attractiveness improvement measures used in developed Western countries were/are not available.
In the future, we can expect new, more advanced attractiveness improvement methods to become available- some dystopian sci-fi stories explore this theme.
Also, the idea that women (as rated by men) are more attractive than men (as rated by women) fits well with our lived experience and common sense.
Women care more about their own looks. Men care more about their partners’ looks. Women spend more time and money on self-care. Most men don’t put any significant effort in improving their looks (the only ones that do are the niche gym bro community, and the even more niche incel “looksmaxxing” commuinity). The entire “beauty industry” almost exclusively serves women3.
Some incels seem particularly upset that the average man is a 3.5 but the average woman is a 6. But for me, it doesn’t seem like they have any valid reason to be upset about it.
If anything, this knowledge should be rather comforting: If you’re a 4/10 or 5/10 guy, you’re already above average! And if you’re a 3/10, you’re not that far below.
"Ackshualy, the average is 5.99, so the 6/10 ratings are also above average!” - Yeah, yeah. Bite me.
On the other hand, if we follow the “4-chan tradition” of “an universal 10 doesn’t exist, a 9 that is your type is your 10”, the top of the range is 9, and the midrange is 5: (1+9)/2 = 5
Yes, there are some men who use the “beauty industry” services. But the other men who don’t use them, call these men “gay”.
Yeah, I don't think most of these arguments hold much water.
People are just self delusional and want to think they're above average - in everything. You see it in looks, you see it in driving skill (75-90% of people think they're above average drivers), you see it at work (70% of people think they're better at their job than average), you see it in self evaluation on every metric (75% think they're "good" people).
Okay, so all these 70%+ of people think they're great at everything - the median American man is 5' 9" and 190 lbs and makes like $50k a year, on the trustworthiness front, a full 50% of people of both genders cheat on their partners. They're crappy in every possible respect. The median American woman, same deal, just shorter and 170 pounds. Everyone is broke Humpty Dumpty, perceiving themselves as Gaston or Belle, and this is a recurring theme true in basically every society. You don't need to resort to skewness and different average calculations to surface any of this, it's just basic self delusion without reference to underlying reality.
The "better than average effect" is robust across hundreds of studies, with n=1M: https://pubmed.ncbi.nlm.nih.gov/31789535/
On wanting to be a "beautiful mid" - actually hot people have hot friends for the most part. People self-segregate, by looks, by wealth, by education, by career, and it's a pretty strong effect. All the rich pretty people hang out together, and all the poor ugly ones do, too.
This is as old as the ancients, who believed that Vulcan (the ugliest of the gods) and Venus (the most beautiful) were husband and wife.